Your CPC keeps climbing. Your budget disappears faster every month. And when you check Google's recommendations, the advice is predictably the same: raise your bids. Before you spend another cent following that guidance, there's a number already sitting inside your account that explains a significant part of the problem. That number is Quality Score, and understanding what Google Ads Quality Score is and how it affects your ad costs is one of the most direct levers you have for cutting what you pay per click.
Quality Score is one of the most actionable metrics in Google Ads precisely because it changes what you pay for every click. It's the difference between paying $1.68 per click and $3.00 for the same position, a gap that emerges directly from the auction formula, which we'll break down below. This article covers what the score measures, how it connects to your CPC through a real formula, what a low score is costing you in concrete dollars, and the specific fixes that move each component. Tools like CheckMyAds flag low Quality Score issues automatically as part of their audit reports, which means you get a clear starting point rather than spending hours guessing which keywords are the problem.
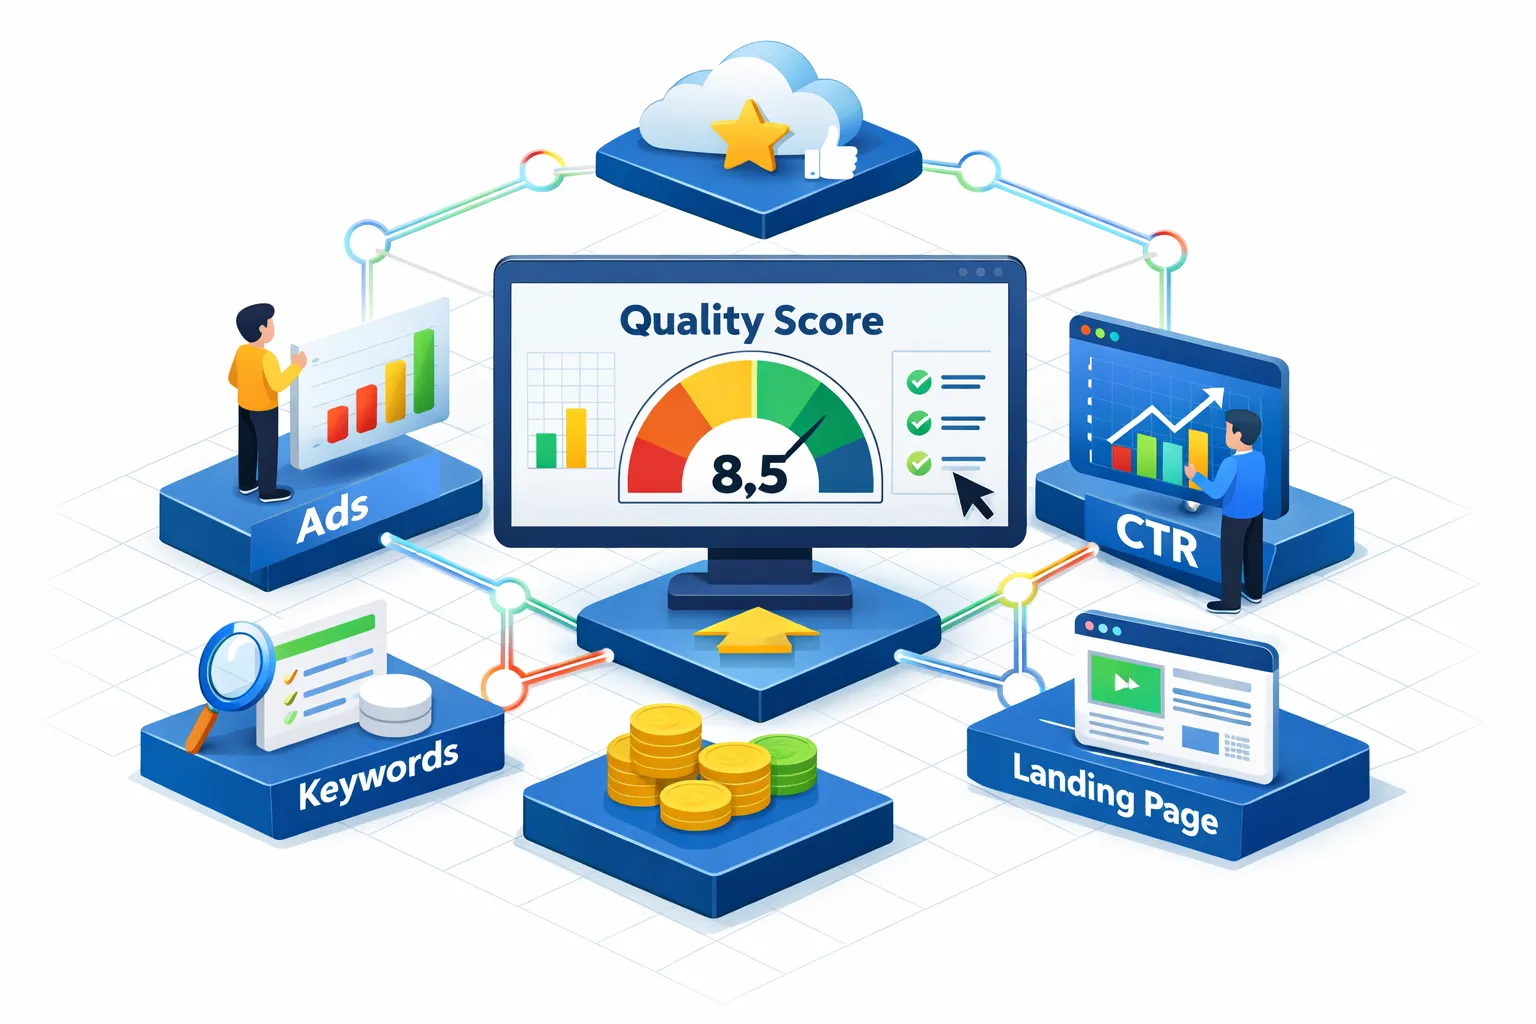
What Google Ads Quality Score Actually Measures
Quality Score is Google's 1-to-10 rating for each keyword in your account. It reflects how relevant and useful your ads, keywords, and landing page are to someone searching for that term, compared to every other advertiser competing in the same auction. A higher score signals to Google that your ad is a good match for the user, and Google rewards that match with better placement and lower costs.
The ratings you see in your interface reflect aggregate performance over the last 90 days, benchmarked against other advertisers targeting the same searches. It's a diagnostic and historical metric, useful for identifying patterns and guiding your optimizations. The actual auction uses a real-time quality evaluation that also accounts for factors like expected ad extension impact and search context, which means the UI score is your compass, not a literal multiplier applied in every individual auction. It's not an absolute measure of quality, either. It's a relative one.
Are hidden account issues quietly draining your budget?
CheckMyAds surfaces the exact keywords, components, and cost drivers behind waste so you know what to fix first.
Request Free AuditThe Three Components Google Evaluates
Expected CTR is Google's prediction of how likely your ad is to get clicked when shown, based on historical data and how closely the keyword matches the search query. Ad relevance measures how well your ad copy aligns with the intent behind the search. Landing page experience assesses how relevant, fast, and user-friendly your page is after the click, covering content match, load speed, and mobile usability. Each component is rated as Above Average, Average, or Below Average, and these ratings are what you act on when improving your score.
Where to Find Your Score in Google Ads
Go to the Keywords tab, click Modify Columns, and look for the Quality Score section. You can add the overall score plus individual columns for each component. If a keyword shows a dash instead of a number, it doesn't have enough impression data to generate a rating yet. Once you see Below Average flags in any component column, you have your starting point.
How Quality Score Affects Ad Costs and CPC: The Formula Behind the Number
Most advertisers assume CPC is driven by their max bid. It isn't, or at least not entirely. Quality Score changes what you pay per click, often by a significant margin, and the mechanics are more straightforward than they look.
The Ad Rank Formula, Simplified
In simplified terms, Ad Rank is calculated as Max CPC Bid multiplied by Quality Score, though the actual auction also weighs expected ad extension impact and real-time search context. This simplified model is still useful for understanding the core dynamic: a competitor bidding $3.00 with a Quality Score of 5 has an Ad Rank of 15, while you bidding $2.00 with a Quality Score of 9 have an Ad Rank of 18. You win the top position at a lower max bid. The higher your Quality Score, the less you need to bid to outrank competitors. The underlying auction mechanics and formula have been examined in depth by industry analysts who break down how those variables interact.
How Actual CPC Is Calculated in the Auction
Your actual CPC is not your max bid. It's calculated as the next advertiser's Ad Rank divided by your Quality Score, plus $0.01. Here's what that looks like in practice: if the advertiser below you has an Ad Rank of 15 and your Quality Score is 9, your actual CPC works out to $1.67 plus $0.01, which equals $1.68, even though your max bid was $2.00. The gap between what you're willing to pay and what you actually pay is shaped by your Quality Score. This is why the impact of Quality Score on CPC is both direct and measurable, not just a theoretical benefit.
The Real Cost of a Low Quality Score
Quality Score isn't an abstract rating to track out of curiosity. The gap between a score of 3 and a score of 9 translates into real dollars on every click you pay for. Industry benchmark analyses make this concrete, though specific figures can vary by account and category. For broader perspective on whether Quality Score still materially impacts costs and performance, see industry coverage that revisits this question periodically.
CPC Discounts and Penalties by Score Level
According to widely cited advertiser performance analyses, a Quality Score of 10 carries roughly a 50% CPC discount compared to an average score of 5, while a score of 3 results in approximately a 150% penalty. At a score of 1 or 2, you can expect to pay dramatically more per click than competitors, and your ad may rarely show at all. Some analyses suggest that for every point below 5, CPA increases by roughly 16%, with the inverse holding true above 5. These aren't minor fluctuations, they compound across every click you pay for.
A Concrete Example of What the Dollar Difference Looks Like
Consider two advertisers bidding on the same keyword with the same $3.00 max bid. Advertiser A has a Quality Score of 4. Advertiser B has a Quality Score of 8. Advertiser B wins a higher position and pays significantly less per click because their Ad Rank is higher and the actual CPC formula works in their favor. Multiply that difference across thousands of clicks per month and you're looking at budget that either goes toward more conversions or disappears into inflated CPCs.
The scale becomes striking at the account level. One case study, attributed to a utility billing company in a vendor-documented analysis, found that improving Quality Score from 6.5 to 8.9 over six years generated over $1.5 million in total CPC savings, with $632,000 saved in the final year alone. Even if your account is a fraction of that size, the directional impact holds: sustained Quality Score improvements accumulate into meaningful budget recovery over time.
What Is Pulling Your Quality Score Down
A score of 4 caused by weak expected CTR needs a different response than a score of 4 caused by poor landing page experience. Before jumping to fixes, identify which component Google has flagged as Below Average. That's where the most meaningful gains are concentrated.
Weak Expected CTR Signals
The most common culprits are generic ad copy that doesn't match the specific keyword triggering the ad, missing keywords in headlines, no clear call to action, and ad groups that bundle too many loosely related keywords under the same ads. Each of these reduces the predicted likelihood of a click because the ad doesn't feel tailored to what the user searched. Google's prediction is based on historical data, so generic copy that applies to a dozen searches consistently underperforms compared to copy written for a specific query.
Ad Relevance Gaps and Loose Campaign Structure
Low ad relevance typically comes from ad groups stuffed with unrelated keywords, where the copy talks broadly about a product category instead of addressing the specific intent behind each search. When someone types a highly specific query and sees an ad that could apply to any of ten related products, relevance drops. The structural fix is tighter thematic organization: one theme per ad group, with copy that mirrors the search intent for that theme rather than the broader category.
Landing Page Experience Problems
Google penalizes post-click experiences that don't deliver on the ad's promise. Slow load speeds, pages that don't match the offer in the ad, poor mobile usability, buried CTAs, and low trust signals all drag this component down. When a user clicks an ad expecting a specific product or offer and lands on a generic homepage, the disconnect registers as a poor experience. Fixing landing page experience tends to improve both Quality Score and conversion rate at the same time, which makes it one of the highest-leverage changes you can make in any account.
Fixes That Move Each Quality Score Component
Structural changes produce more reliable improvements than cosmetic tweaks. Start with whichever component is rated Below Average. That's where the biggest score gains are concentrated, and chasing a perfect 10 across every keyword is an inefficient use of time.
Improving Expected CTR
Write keyword-specific headlines and include the main keyword in at least one headline per ad. Add concrete, specific benefits: free shipping, same-day delivery, a clear offer. Use direct calls to action. Test multiple ad variations per ad group and pause underperformers. CTR history builds gradually, so consistent testing compounds into meaningful improvements over weeks rather than days, don't expect overnight results from a single variation swap.
Tightening Ad Relevance
Restructure ad groups so each one contains only closely related keywords. Write ad copy that mirrors the specific search intent for that group, not the general product category. A simple test: if someone reads the ad, they should feel it was written for their exact search. If the same ad could appear for five different queries without any modification, the structure needs work.
Fixing Landing Page Experience
Match the headline and first sentence of your landing page to the specific ad that sent the user there. Improve page load speed, especially on mobile, since Google's assessment weighs mobile experience heavily. Simplify forms, remove navigation elements that pull focus away from the conversion goal, and add trust signals like reviews, guarantees, and contact information. Each of these changes closes the gap between what the ad promises and what the page delivers, which is the core of what Google's algorithm measures here.
How CheckMyAds Surfaces Quality Score Problems Before They Drain Your Budget
Knowing the theory is useful. Knowing which of your 200 keywords currently has a Below Average landing page experience score is what saves money. That's the gap CheckMyAds closes. When you run an audit (How It Works), CheckMyAds scans your entire account and flags keywords with low Quality Scores in a prioritized report, alongside context on which specific component is underperforming.
The audit doesn't return a raw data dump. It groups low Quality Score keywords alongside other high-priority issues: missing negative keywords, conversion tracking errors, brand term leakage, and structural problems across campaign types. The result is a single action list ordered by impact, not a spreadsheet you have to interpret yourself.
For business owners managing their own ads and for traffic managers auditing a new client account, this removes the manual triage entirely. You connect your account with read-only access, run the scan, and receive an exportable report with issues ranked by impact. Instead of manually reviewing every keyword column in Google Ads hoping to spot the problems, you start from a clear list of what to fix first.
Start With What's Already Costing You
Quality Score is a 1-to-10 per-keyword rating that reflects the relevance of your ads, keywords, and landing pages. It feeds into Ad Rank, and through Ad Rank, it shapes what you pay per click. A low score doesn't just lower your position, it inflates your CPC compared to competitors who aligned their ads and pages with user intent. That's how quality score affects ad costs: not as a minor adjustment, but as a multiplier on every dollar you spend.
Expected CTR, ad relevance, and landing page experience each respond to specific, reliable fixes. The most efficient path isn't trying to improve everything at once, it's identifying which component Google has rated Below Average in your account and addressing that first. That's where the CPC savings are concentrated. Knowing what Google Ads Quality Score is and how it affects your ad costs is only the first step; acting on the right component is what moves the number.
If you don't know which keywords are dragging your score down, run a CheckMyAds audit. It takes minutes, requires no credit card, and surfaces exactly where the problem is, so you can fix it without manually sifting through your entire account. For policy and usage details, see CheckMyAds, Terms of Service.